Integrate CUBA with Metabase BI solution
With CUBA Filters and aggregation a lot of ad-hoc quiering is possible. But to get meaningful information out of the raw data if only possible to a very limited degree. In this blog post i want to show you how CUBA can be expanded with a powerful business intelligence tool called Metabase.
Although i planned to do a blog post about the integration between CUBA and Metabase a long time ago, this forum topic remebered me about the topic and so i’ll pick it up now - so thanks for rembering.
What is metabase and why it’s worth considering
Metabase is a tool i came across a few month ago via the great podcast: the changelog. It is an open source software that fits into the category business intelligence. Essentially it provides the ability to connect with a database and let the user ask questions to the system. Via a very intuitive user interface the user is able to get ver good answers even it they have never heard of the term SQL. Besides traditional relational databases Metabase also provides support for other datastores like MongoDB or Druid.
Besides the “ask question” process another real key benefit of the software that these questions can be stored and the answers can be displayed in various shapes and sized through dashboards.
Before diving into the different possibilities of Metabase - let’s start with installing and integrating it with our CUBA app.
How to get started with Metabase for a CUBA app
The starting point for Metabase to work is to connect it with the running database of the CUBA application. For this tutorial i’ll stick to the cuba-ordermanagement example.
To get up and running i used Docker to create a PostgreSQL instance as well as the Metabase instance. The following command line creates postgres instance that the cuba-ordermanagement app can connect to:
docker run -it --rm -p 5432:5432 -e POSTGRES_PASSWORD=postgres postgresAfter setting the connection details in Studio, the CUBA app should be up and running.
Metabase has different installation options. As one of them is a Docker image, we will use that:
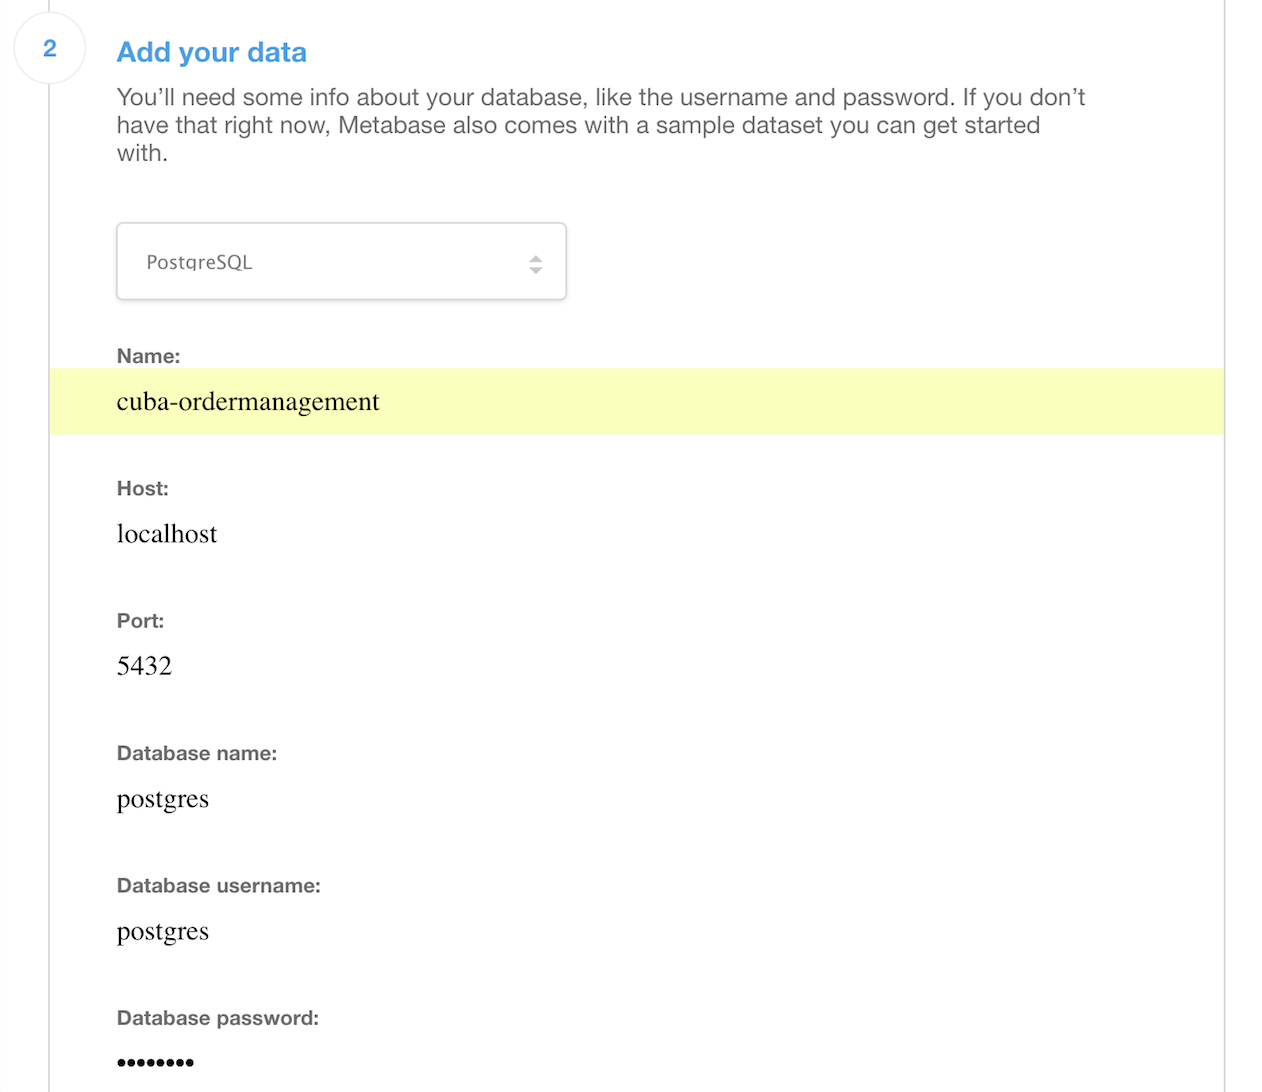
docker run -it --rm -p 3000:3000 --name metabase metabase/metabase This welcome screen is followed by a few setup steps. One of them is the “add your data” step which basically requies you to set up the database connection. We’ll configure the PostgreSQL database as shown below:

With this settings in place, Metabase is fully configured and able to answer your first question.

Show all orders as raw data
A question in metabase is a query definition which is heavily UI based. The first question that we can ask Metabase is to show all Orders, that are not deleted as raw data in a table.
The first thing to be selected is the base table (after selecting the correct datasource). For now we can select “OM Order” as the base table. The next thing to define are filter that should be applied to this data. In this case we only want to see the data that haven’t been deleted which means that the column “deleted_ts” is null. The next section that can be changed is the “view” section. For now we’ll stick to “raw data” so we are able to see the columns.

In the image underneath the filter popup you’ll already see the “answer” to the question we asked. Metabase basically creates a CRUD user interface where you can traverse through the data via links. So in this case a click on the corresponding Id will show the details of this order. You can also switch to the related line items of this order on the left.
At the moment this screen is more or less a database viewer with additional relationship traversal possibility. This is quite powerful but kind of similar to what we know by CUBA. This is why we’ll switch gears a little bit for now and ask a little more realistic questions.

Top 10 cities that created most orders
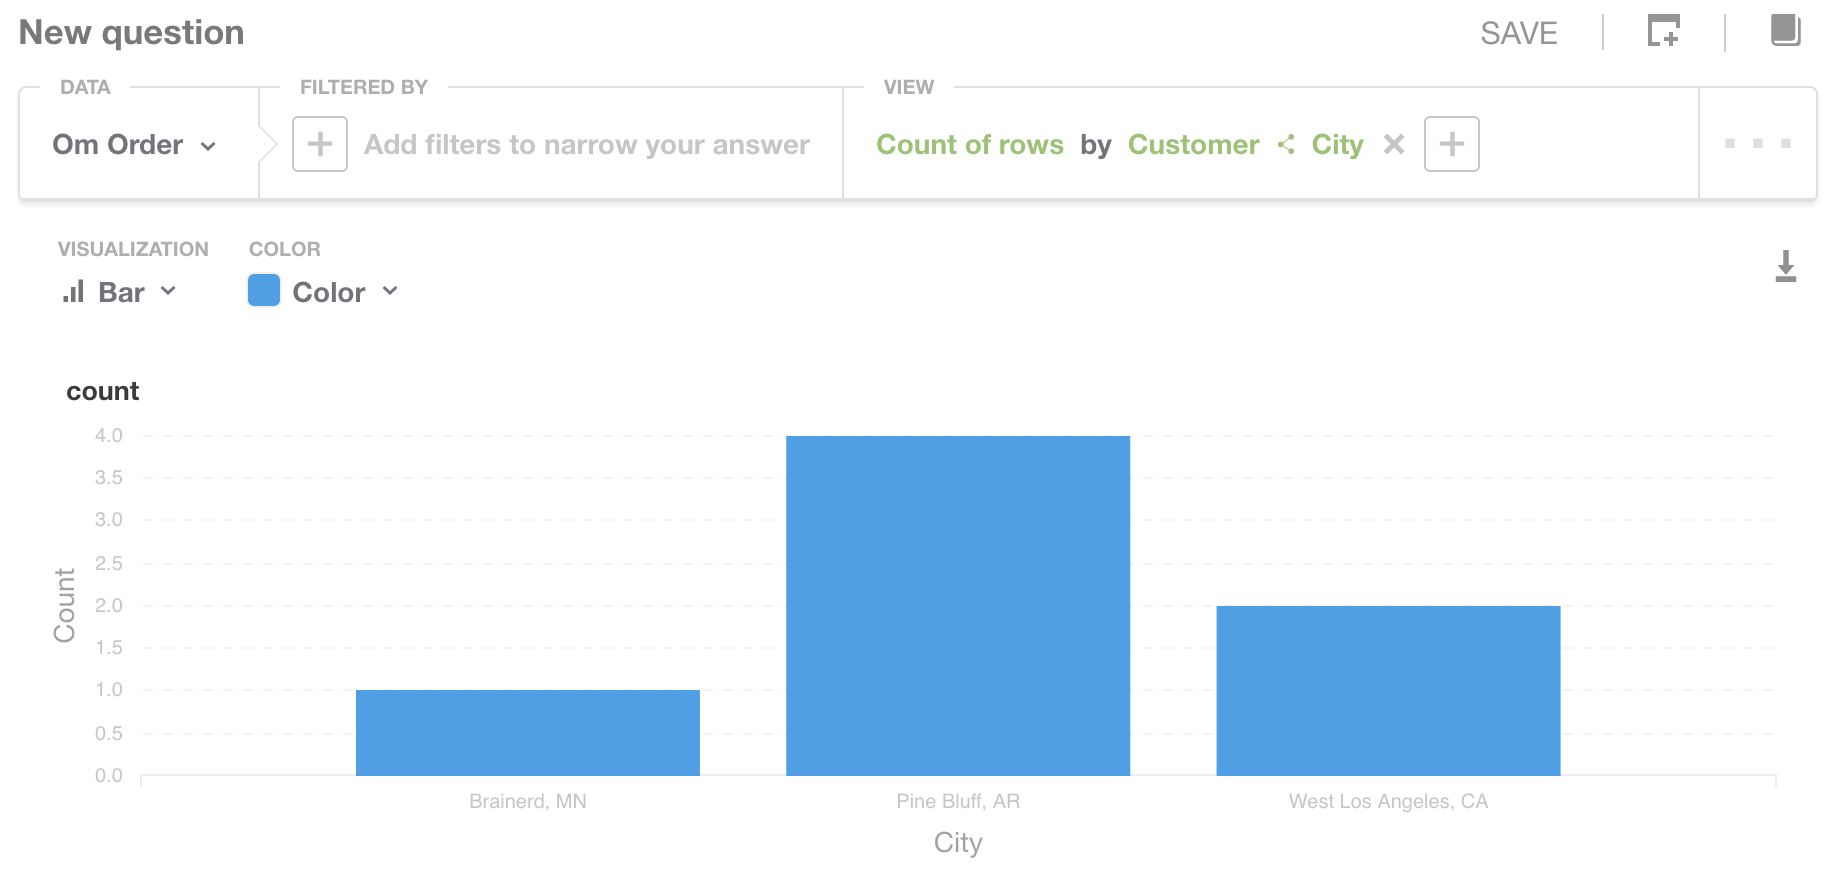
The next question is a little more towards real business questions. In this case we want to get the information which cities have placed most orders. This can either be the case due to the high amount of the customers that live in this city have placed a few orders or a few customers placed many orders.
To achieve this we’ll take the “Om Order” table as the base data. There is nothing to filter because we don’t want to cut any data out here. In the view section instead of selecting “raw data” we’ll use “Count of rows”. This alone would give us the total count of orders. As we want to group this by the customers’ city, we’ll select “add a grouping”. A popup appears that shows the different attributes of the order entity.

Next to these direct attributes of the order the relation to the customer is shown, which will show all attributes of the customer. Select the “city” attribute.
As the visualisation a pie chart seems pretty resonable, so we’ll choose this. On the left you’ll see the result of this question.
The question can be saved through the button in the upper right. After setting a meaningful name like “Top 10 cities of orders” you’re asked if you want to add the question to a dashboard. Dashboards are a powerful feature of Metabase that allow to show answers to your questions in a pretty fancy and accessible way.
In case you haven’t created one before you can create it right now. Next you can put the question as a widget to your selected / created dashboard.

Get this years turnover on a per product basis
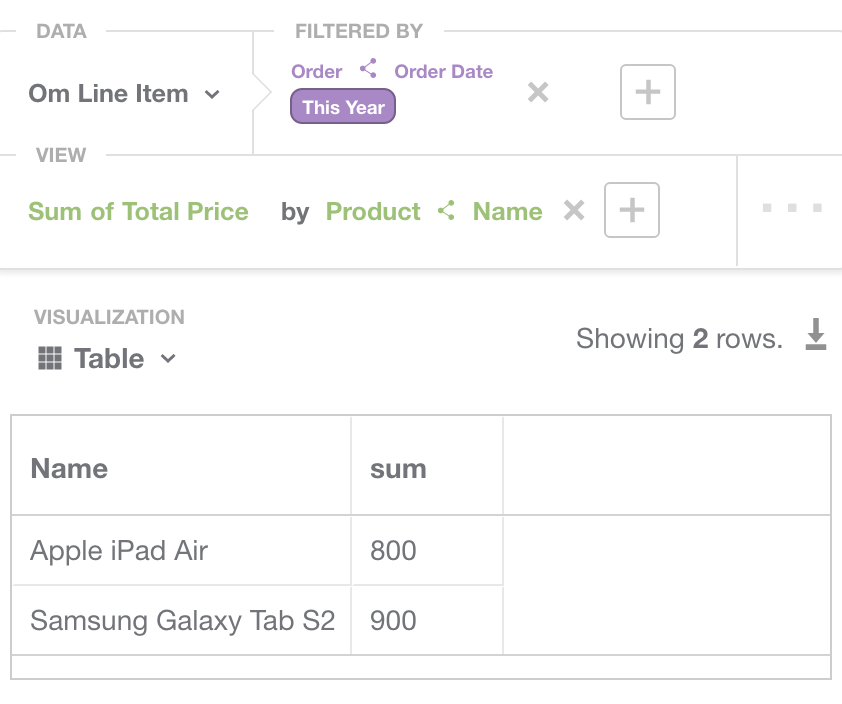
The next question that we can ask is about the turnover per product. In case we are not interested in the order entity we can just query against the LineItem entity. Nevertheless the order should have been placed within the current year.
For this to work we have to take “Om Line Item” as the base data. The filter section we’ll select “Order > Order Date” and choose “This year”. This will filter the data accordingly. In the view section we’ll take “Sum of Total price” and the grouping will be “Order > Name”. The resulting table can either taken as a data table or change the visualisation to “Bar chart”.

Enhance the parsed data model
For now the screens show a few columns of the database that are not really relevant for business questions. This is the case because the data model that got’s extracted from the database does contain all columns available. In case we don’t want to see all these technical columns we can tell Metabase to not display them.
There is a menu item called “Admin panel”. Within that there a menu “Data model” which allows you to enhance the parsed model.
After selecting the table you want to enhance will show different options on this table. First you can change the visibility to hide it in general. Next you can set a description and change the name. For each column within this table you are able to do the same things: set name, description and visibility (with the additional possibility to “Only in detail view” that will remove the column from the table view). For the columsn you can also set the filtype in order to be able let Metabase work with the different columns more effectivly. One example of this is that the a Column can be set to type “City” so Metabase will be able to display the data correctly on a Map.
Next to the feature of enhancing your data model there are possibilities to either predefine “Segments” and “Metrics”. A segment is basically a filter on a certain table that only segmented the data in a certain way. After saving a segment is displayed next to the direct attributes of the selected data table. The same is true for Metrics. Metrics are a definition on the “View” section of the question. A Metric can either contain only aggregation information or it can be combined with a Segment in order to do the filtering as well.

Redress the poor dogs
The next example of questions is the following: “Metabase: Tell me the poor dogs of the portfolio” meaning, getting information about the product categories that have the least amount of overall turnover.
When you try to get that done via the user interface you’ll probably get stuck. If you don’t: tell me, because i got stuck. The reason for this is that i was not able to define such a question.

So in order to get these information Metabase allows you to activate the SQL editor instead of using the generic user interface. On the upper right of the “Ask question” user interface screen the button will activate the SQL editor.
To answer the question the following SQL should be able to produce the corresponding data:
SELECT pg.NAME as category_name, SUM(li.TOTAL_PRICE) as total_turnover
FROM OM_LINE_ITEM li
JOIN OM_PRODUCT p ON p.id = li.PRODUCT_ID
JOIN OM_PRODUCT_CATEGORY pg ON p.CATEGORY_ID = pg.ID
GROUP BY p.CATEGORY_ID, pg.NAME
ORDER BY total_turnover asc limit 3
The default visualisation for the SQL-Question is “Table”, but you can change it to something like a Pie Chart as well (although that does not make much sense in this example).
The SQL questions can be stored alongside to the ones we created via the user interace. Therefore they are useable in the Dashboard views as well.
Integrate dashboard within the CUBA application
For integration both user interfaces there are options on different levels. An example of this would be an embedded type in CUBA that allows you to inlcude other web pages via an IFrame. Currently Metabase will block beeing included via IFrames via a specific HTTP header called ‘X-Frame-Options’.
Unfortunately there is no clear way to do the integration. As the product is currenty pre 1.0, there is no public API in order to get information from Metabase yet.
Nevertheless an easy and very powerful integration point are links. So instead of trying to directly embed dashboards of metabase into the CUBA application you can in the main window of the CUBA application create a Link to the corresponding dashboard in Metabase. With this approach it additional is possible to use the powerful dashboard creation feature.
With this i would like to encourage you to take a look at Metabase. Since Metabase makes it so easy to get up and running and with this guide you should have a good starting point to do the integration.
